Matplotlib
 Screenshot of Matplotlib plots and code | |
| Original author(s) | John D. Hunter |
|---|---|
| Developer(s) | Michael Droettboom, et al. |
| Initial release | 2003[1] |
| Stable release | 3.9.2[2] |
| Repository | |
| Written in | Python |
| Engine | Cairo, Anti-Grain Geometry |
| Operating system | Cross-platform |
| Type | Plotting |
| License | Matplotlib license |
| Website | matplotlib |
Matplotlib is a plotting library for the Python programming language and its numerical mathematics extension NumPy. It provides an object-oriented API for embedding plots into applications using general-purpose GUI toolkits like Tkinter, wxPython, Qt, or GTK. There is also a procedural "pylab" interface based on a state machine (like OpenGL), designed to closely resemble that of MATLAB, though its use is discouraged.[3] SciPy makes use of Matplotlib.
Matplotlib was originally written by John D. Hunter. Since then it has had an active development community[4] and is distributed under a BSD-style license. Michael Droettboom was nominated as matplotlib's lead developer shortly before John Hunter's death in August 2012[5] and was further joined by Thomas Caswell.[6][7] Matplotlib is a NumFOCUS fiscally sponsored project.[8]
Comparison with MATLAB
Pyplot is a Matplotlib module that provides a MATLAB-like interface.[9] Matplotlib is designed to be as usable as MATLAB, with the ability to use Python, and the advantage of being free and open-source.[citation needed]
Plot Types
Matplotlib supports various types of 2 dimensional and 3 dimensional plots. The support for two dimensional plots is robust. The support for three dimensional plots was added later and while it is good, it is not as robust as 2 dimensional plots.
Examples
-
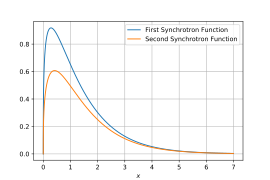 Line plot
 -
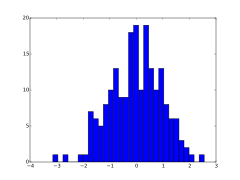 Histogram
 -
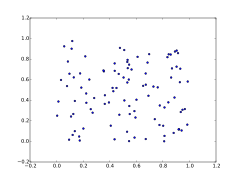 Scatter plot
 -
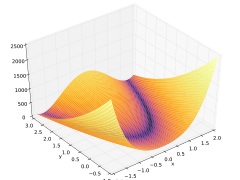
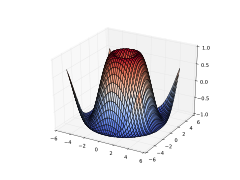 3D plot
 -
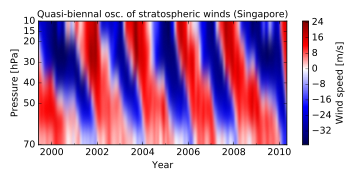 Image plot
 -
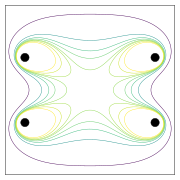 Contour plot
 -
 Scatter plot
 -
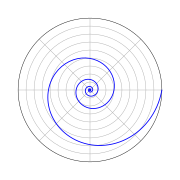 Polar plot
 -
 Line plot
 -
 3-D plot
 -
 Image plot


Animations
Matplotlib-animation[10] capabilities are intended for visualizing how certain data changes. However, one can use the functionality in any way required.
These animations are defined as a function of frame number (or time). In other words, one defines a function that takes a frame number as input and defines/updates the matplotlib-figure based on it.
The time at the beginning of a frame-number since the start of animation can be calculated as -

Toolkits
Several toolkits are available which extend Matplotlib functionality. Some are separate downloads, others ship with the Matplotlib source code but have external dependencies.[11]
- Basemap: map plotting with various map projections, coastlines, and political boundaries[12]
- Cartopy: a mapping library featuring object-oriented map projection definitions, and arbitrary point, line, polygon and image transformation capabilities.[13] (Matplotlib v1.2 and above)
- Excel tools: utilities for exchanging data with Microsoft Excel
- GTK tools: interface to the GTK library
- Qt interface
- Mplot3d: 3-D plots
- Natgrid: interface to the natgrid library for gridding irregularly spaced data.
- tikzplotlib: export to Pgfplots for smooth integration into LaTeX documents (formerly known as matplotlib2tikz)[14]
- Seaborn: provides an API on top of Matplotlib that offers sane choices for plot style and color defaults, defines simple high-level functions for common statistical plot types, and integrates with the functionality provided by Pandas
- GeoPandas:[15] simplifies geospatial work in Python without needing a spatial database like PostGIS[16]
- Cartopy: streamlines map creation in matplotlib by enabling users to specify a projection and add coastlines with a single line of code[17]
Related projects
- Biggles[18]
- Chaco[19]
- DISLIN
- GNU Octave
- gnuplotlib – plotting for numpy with a gnuplot backend
- Gnuplot-py[20]
- PLplot – Python bindings available
- SageMath – uses
Matplotlibto draw plots - SciPy (modules
pltandgplt) - Plotly – for interactive, online Matplotlib and Python graphs
- Bokeh[21] – Python interactive visualization library that targets modern web browsers for presentation
References
- ^ "Copyright Policy".
- ^ "Release 3.9.2". 13 August 2024. Retrieved 22 August 2024.
- ^ "API Overview". matplotlib.org.
- ^ "Matplotlib github stats". matplotlib.org.
- ^ "Announcing Michael Droettboom as the lead Matplotlib developer". matplotlib.org. Archived from the original on 2020-10-27. Retrieved 2013-04-24.
- ^ "Matplotlib Lead Developer Explains Why He Can't Fix the Docs—But You Can – NumFOCUS". NumFOCUS. 2017-10-05. Retrieved 2018-04-11.
- ^ "Credits – Matplotlib 2.2.2 documentation". matplotlib.org. Retrieved 2018-04-11.
- ^ "NumFOCUS Sponsored Projects". NumFOCUS. Retrieved 2021-10-25.
- ^ "Matplotlib: Python plotting — Matplotlib 3.2.0 documentation". matplotlib.org. Retrieved 2020-03-14.
- ^ "Animations using Matplotlib". matplotlib.org. Retrieved 30 Aug 2024.
- ^ "Toolkits". matplotlib.org.
- ^ Whitaker, Jeffrey. "The Matplotlib Basemap Toolkit User's Guide (v. 1.0.5)". Matplotlib Basemap Toolkit documentation. Retrieved 24 April 2013.
- ^ Elson, Philip. "Cartopy". Retrieved 24 April 2013.
- ^ Schlömer, Nico. "tikzplotlib". GitHub. Retrieved 7 November 2016.
- ^ "GeoPandas 0.14.4 — GeoPandas 0.14.4+0.g60c9773.dirty documentation". geopandas.org. Retrieved 2024-04-29.
- ^ Jordahl, Kelsey, geopandas: Geographic pandas extensions, retrieved 2024-04-29
- ^ "Using cartopy with matplotlib — cartopy 0.15.0 documentation". scitools.org.uk. Retrieved 2024-04-30.
- ^ "Bigglessimple, elegant python plotting". biggles.sourceforge.net. Retrieved 24 November 2010.
- ^ "Chaco". code.enthought.com.
- ^ "Gnuplot.py on". gnuplot-py.sourceforge.net. Retrieved 24 November 2010.
- ^ "Bokeh 2.0.0 Documentation". docs.bokeh.org. Retrieved 2020-03-14.